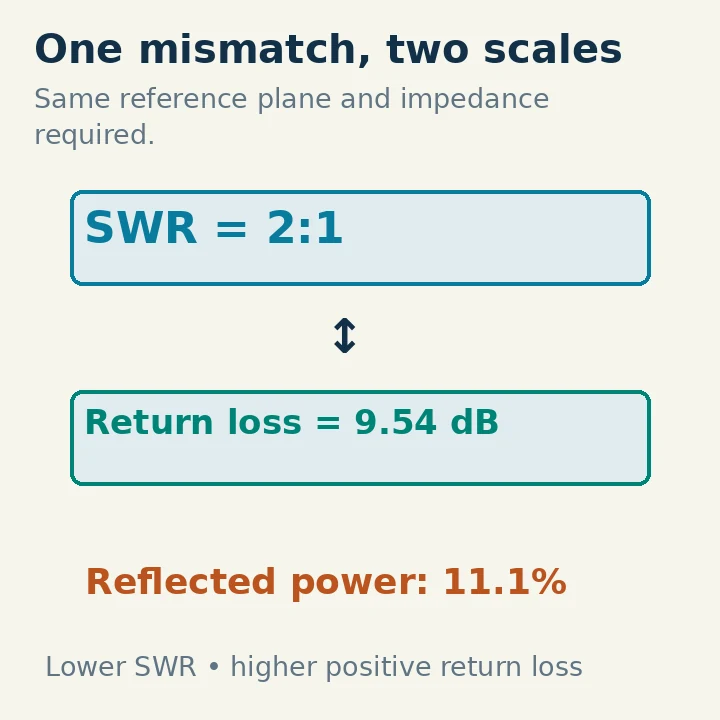
SWR and return loss describe the same port mismatch using different scales. Lower SWR is better, with a perfect match at 1:1. Higher positive return loss is better, with a perfect match approaching infinity in the ideal calculation. A 2:1 SWR corresponds to about 9.54 dB return loss and 11.1% reflected power at the same reference plane.
Neither number, by itself, measures antenna efficiency, radiated power or feed-line loss. Before comparing readings, check the frequency, reference impedance, measurement location and whether a graph shows positive return loss or negative S11 in decibels.
What Is Being Reflected?
A transmission line carries a forward wave toward a load. If the load impedance differs from the line's reference impedance, a reflected wave travels back. The voltage reflection coefficient, written Γ, is the reflected-wave amplitude divided by the forward-wave amplitude at the reference plane. It is generally complex, containing magnitude and phase.
For a real reference impedance Z0, the load reflection coefficient is:
Γ = (ZL − Z0) / (ZL + Z0)
Here ZL is the complex load impedance. For a nominal 50-ohm line terminated in a purely resistive 100-ohm load, Γ = 50/150 = 1/3. A purely resistive 25-ohm load gives Γ = −25/75 = −1/3. Their reflection magnitudes are equal, so their SWR and return loss are equal, although their impedances and reflection phases differ.
That is why an SWR reading cannot tell you whether to lengthen or shorten an antenna, nor whether the load is high resistance, low resistance or reactive. An impedance measurement supplies information that a mismatch magnitude alone does not.
SWR Expresses the Standing-wave Envelope
The forward and reflected waves combine to produce maxima and minima along a line. Voltage standing wave ratio, VSWR, is the ratio of the maximum voltage amplitude to the minimum. Amateur operators often shorten this to SWR.
Using the magnitude of the reflection coefficient:
SWR = (1 + |Γ|) / (1 − |Γ|)
For |Γ| = 1/3, SWR = (4/3)/(2/3) = 2:1. With no reflection, |Γ| = 0 and SWR = 1:1. With complete reflection in the ideal lossless passive case, |Γ| = 1 and the denominator approaches zero, so SWR approaches infinity.
The “2” in 2:1 is a voltage-envelope ratio. It does not mean twice as much forward power as reflected power. Confusing those quantities can greatly overstate the reflected fraction. The field pattern along a practical lossy cable is more complicated, but the port reflection coefficient still provides the mismatch relationship used by instruments.
Return Loss Expresses the Reflected Fraction in Decibels
Return loss compares forward power with reflected power:
RL = 10 log10(Pforward / Preflected) = −20 log10|Γ|
The 20 multiplier applies to the amplitude ratio. The 10 multiplier applies to the power ratio. For the same reference impedance, reflected power fraction is |Γ|², not |Γ|. MathWorks' antenna documentation gives the return-loss relationship in terms of S11; Mini-Circuits' reflection discussion also relates impedance mismatch to the reflection coefficient.
With |Γ| = 1/3, reflected power fraction is 1/9, or about 11.1%. Return loss is −20 log10(1/3), approximately 9.54 dB. If forward power is 100 W at that reference plane, the corresponding reflected component is about 11.1 W. This is a calculation at one plane, not a complete station power budget.
A useful shortcut is that 10 dB return loss means 10% reflected power, 20 dB means 1%, and 30 dB means 0.1%. Each additional 10 dB reduces the reflected fraction by a factor of ten. Those numbers describe mismatch; they do not mean a cable is dissipating that fraction as heat.
Convert the Readings Without Mixing Conventions
To convert from SWR, first calculate |Γ| = (SWR − 1)/(SWR + 1). Then square it for reflected power fraction or apply −20 log10 for return loss. To convert from return loss, calculate |Γ| = 10^(−RL/20) and use the SWR equation.
| SWR | Return loss, positive dB | Reflected power |
|---|---|---|
| 1.0:1, ideal | Approaches infinity | 0% |
| 1.2:1 | 20.83 dB | 0.83% |
| 1.5:1 | 13.98 dB | 4.00% |
| 2.0:1 | 9.54 dB | 11.11% |
| 3.0:1 | 6.02 dB | 25.00% |
| Complete reflection, ideal | 0 dB | 100% |
Values are rounded and assume the same port reference. A return loss of 10 dB corresponds to about 1.925:1 SWR, so “10 dB is approximately 2:1” is a useful approximation rather than an exact equality.
There is no universal SWR threshold that makes every transmitter, amplifier and tuner happy. Follow the equipment's operating and protection limits. A radio may reduce output as mismatch rises; that behavior changes the practical operating result without changing the mathematics connecting SWR and return loss.
Why One Graph Says +20 dB and Another Says −20 dB
A VNA often plots S11 log magnitude = 20 log10|S11|. With an ordinary real port reference, S11 is the input reflection coefficient. A well-matched passive load therefore appears as a negative value on this plot. Positive return loss is the negative of that log-magnitude value.
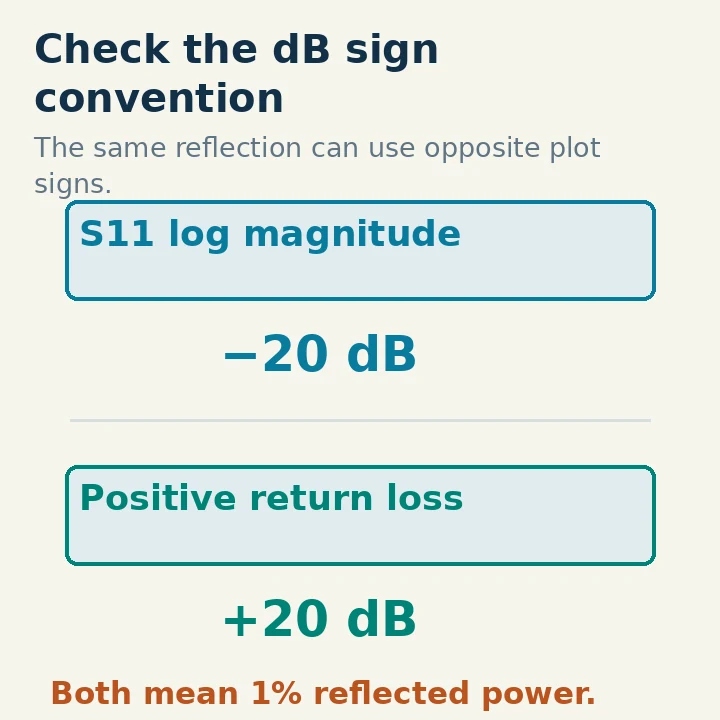
Thus S11 = −20 dB and return loss = +20 dB describe the same reflection magnitude, corresponding to |Γ| = 0.1 and 1% reflected power. On an S11 log-magnitude graph, a deeper downward dip indicates a better match. On a positive return-loss graph, a higher upward peak indicates a better match.
Read the axis label before describing a “better” curve. Some interfaces use informal or inconsistent terminology, especially when discussing “antenna return loss.” Establish the equation and sign convention rather than assuming that every negative number is an error. Also check whether the selected trace is S11, S21, impedance or another parameter.
The Measurement Plane Changes the Result
A measurement at the antenna connector and a measurement at the radio end of a long cable are different observations. The cable introduces attenuation and, with mismatch, impedance transformation. In a uniform lossless line, reflection magnitude and SWR remain constant along the line while reflection phase and impedance vary. Loss changes that magnitude relationship.
For a simple matched-line illustration, suppose the cable has 3 dB one-way attenuation and the antenna has 10 dB return loss at its connector. The reflected component experiences attenuation on both the outward and return journeys relative to the incident wave at the instrument. The radio-end return loss is approximately 10 + 2 × 3 = 16 dB, under those assumptions. The apparently better match includes cable loss; it does not show that the antenna improved.
A defective or very lossy feed line can therefore make a poor load look less mismatched from the shack. Use calibration or appropriate cable correction to establish the desired reference plane, and retain the assumptions behind any correction. Do not subtract an arbitrary SWR number to “remove the cable”: SWR is not a linear loss scale.
A tuner creates another reference-plane issue. A good match at its radio-side connector means the tuner presents a suitable input to the transmitter. It does not establish a low SWR on the antenna-side feed line or high radiation efficiency. The tuner and downstream components still face their actual load conditions.
Make a Useful Analyzer Measurement
Disconnect the analyzer from any transmitting system, including paths through switches or coupled equipment. Follow its manual for calibration and permitted signal levels. Calibrate at the intended connection plane with the correct standards where the instrument supports it, and use the reference impedance appropriate to the system.
Measure across the actual operating range rather than recording only the deepest dip. Note the frequency, cable arrangement and antenna configuration. A narrow match at one frequency may not cover the intended voice or digital segment. Repeat with the same arrangement if you want to assess a later adjustment.
If an SWR meter and a VNA disagree, compare conditions first: frequency, power, reference plane, connector adapters and calibration. Directional wattmeters have finite directivity, and very small reflected readings can be difficult to resolve accurately. A graph that looks perfectly flat at 1.00:1 should not be given more precision than the instrument can support.
Use impedance data when deciding a matching adjustment. Two loads with the same SWR may need different changes. Use separate loss or radiation evidence when evaluating efficiency. A dummy load can present an excellent match while deliberately converting nearly all accepted RF into heat.
Choose the Scale That Helps the Task
SWR is convenient for everyday station matching and equipment-limit checks. Return loss is convenient for comparing reflection performance in decibels and interpreting RF test specifications. Neither is inherently a more truthful measurement when derived from the same reflection data.
Record the scale and reference plane explicitly: “1.5:1 at 14.2 MHz, measured at the antenna connector” is more useful than “good SWR.” Likewise, “14 dB positive return loss at a 50-ohm port” prevents a sign-convention misunderstanding. Once those details are fixed, the two scales tell a consistent story about mismatch—and leave efficiency, loss and radiation pattern to their own measurements.